Projects
Web Application
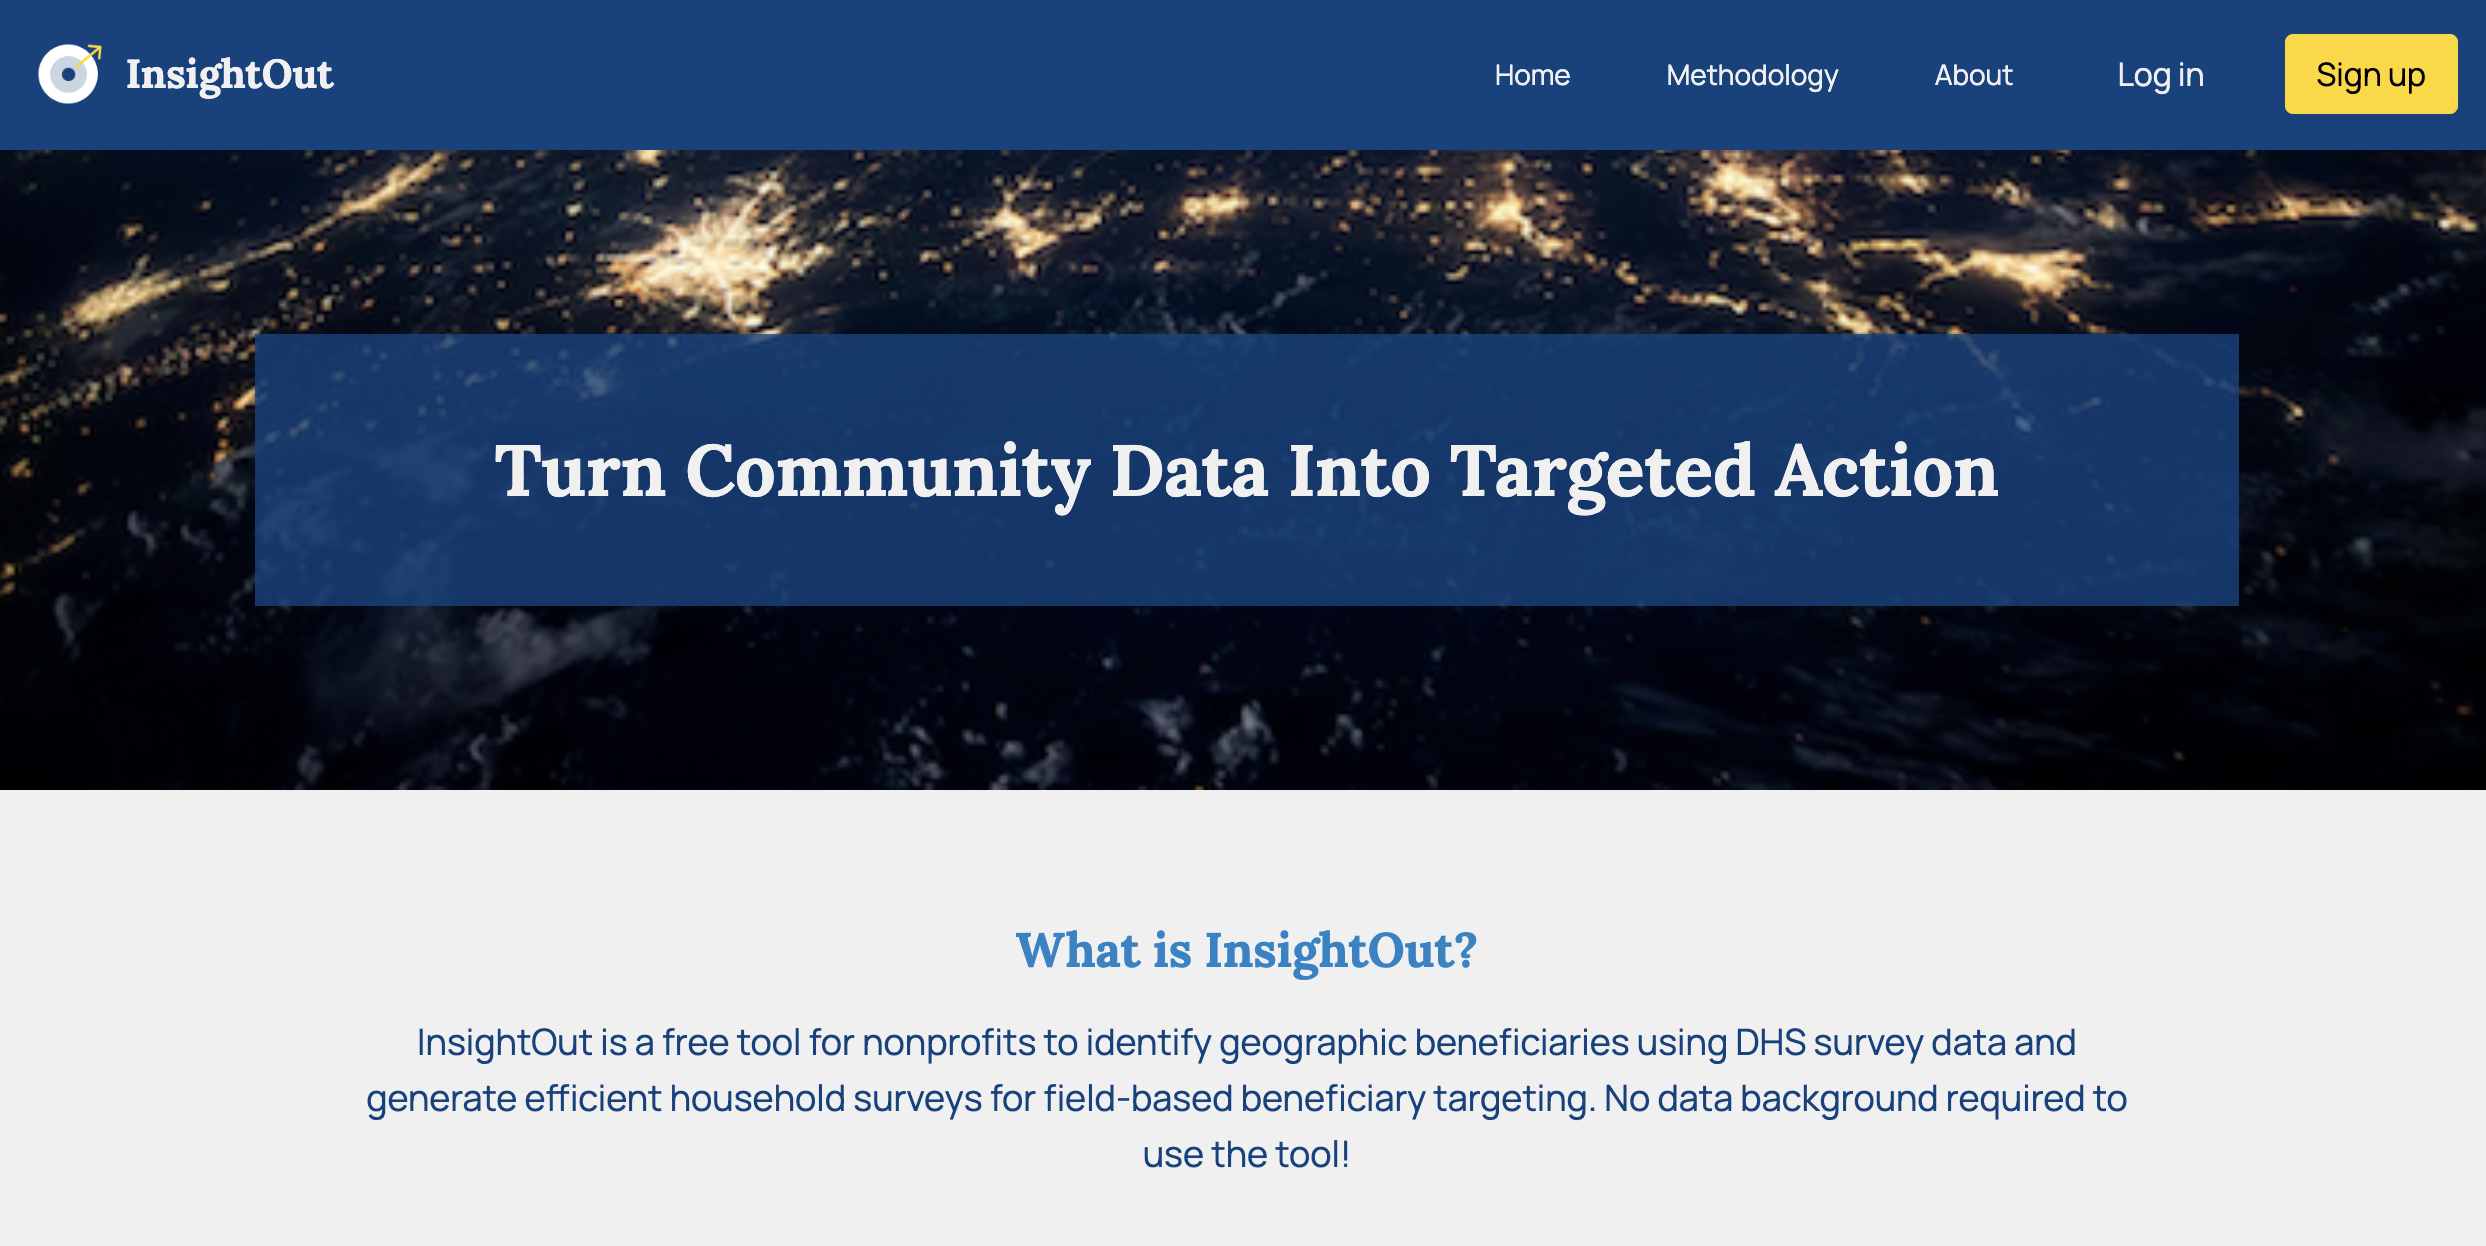
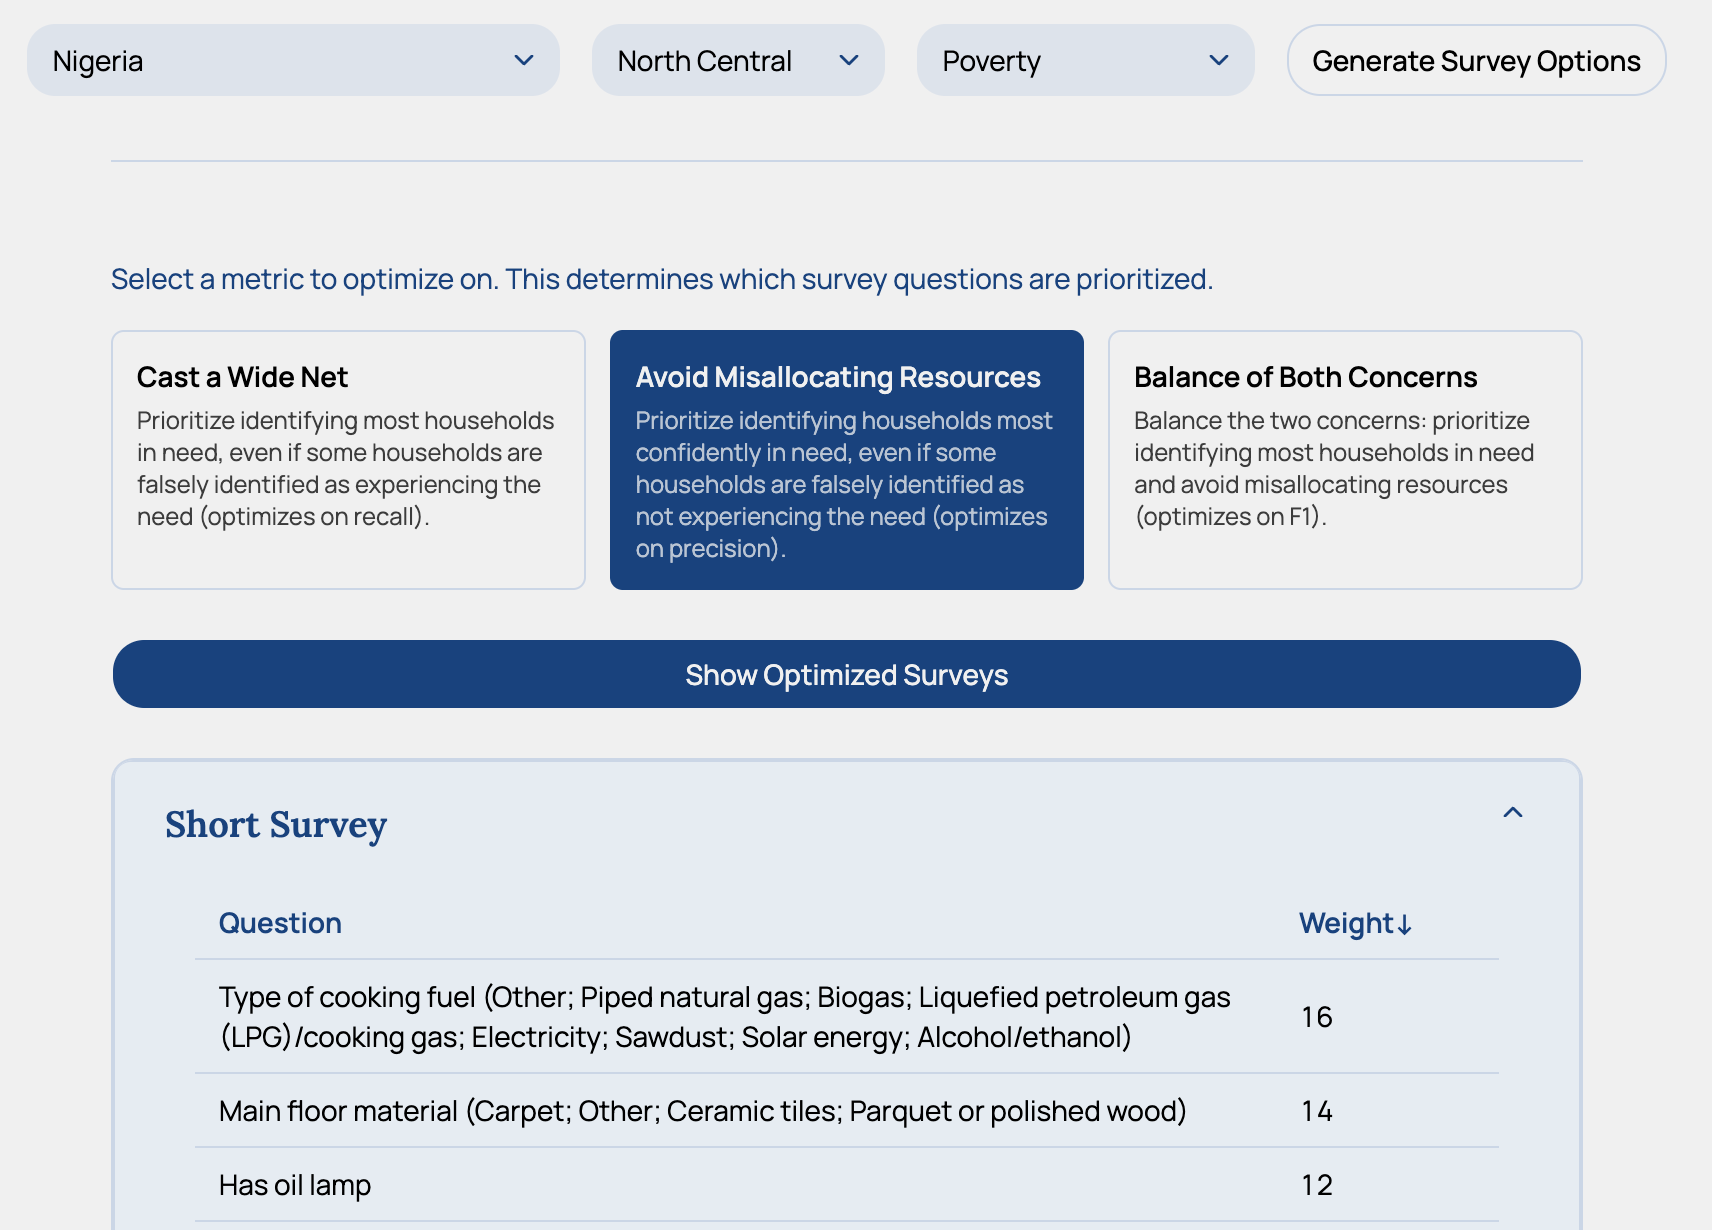
Insight Out
- A deployed self-service tool that lets nonprofit staff define their own target metrics and identify beneficiary populations in any geography, without engineering support.
- On this team project, I built the frontend from scratch in Svelte and implemented the authentication system in Django, developing against jointly designed API contracts so the frontend and backend could progress in parallel.
Svelte · Django · REST APIs

Geospatial Analysis
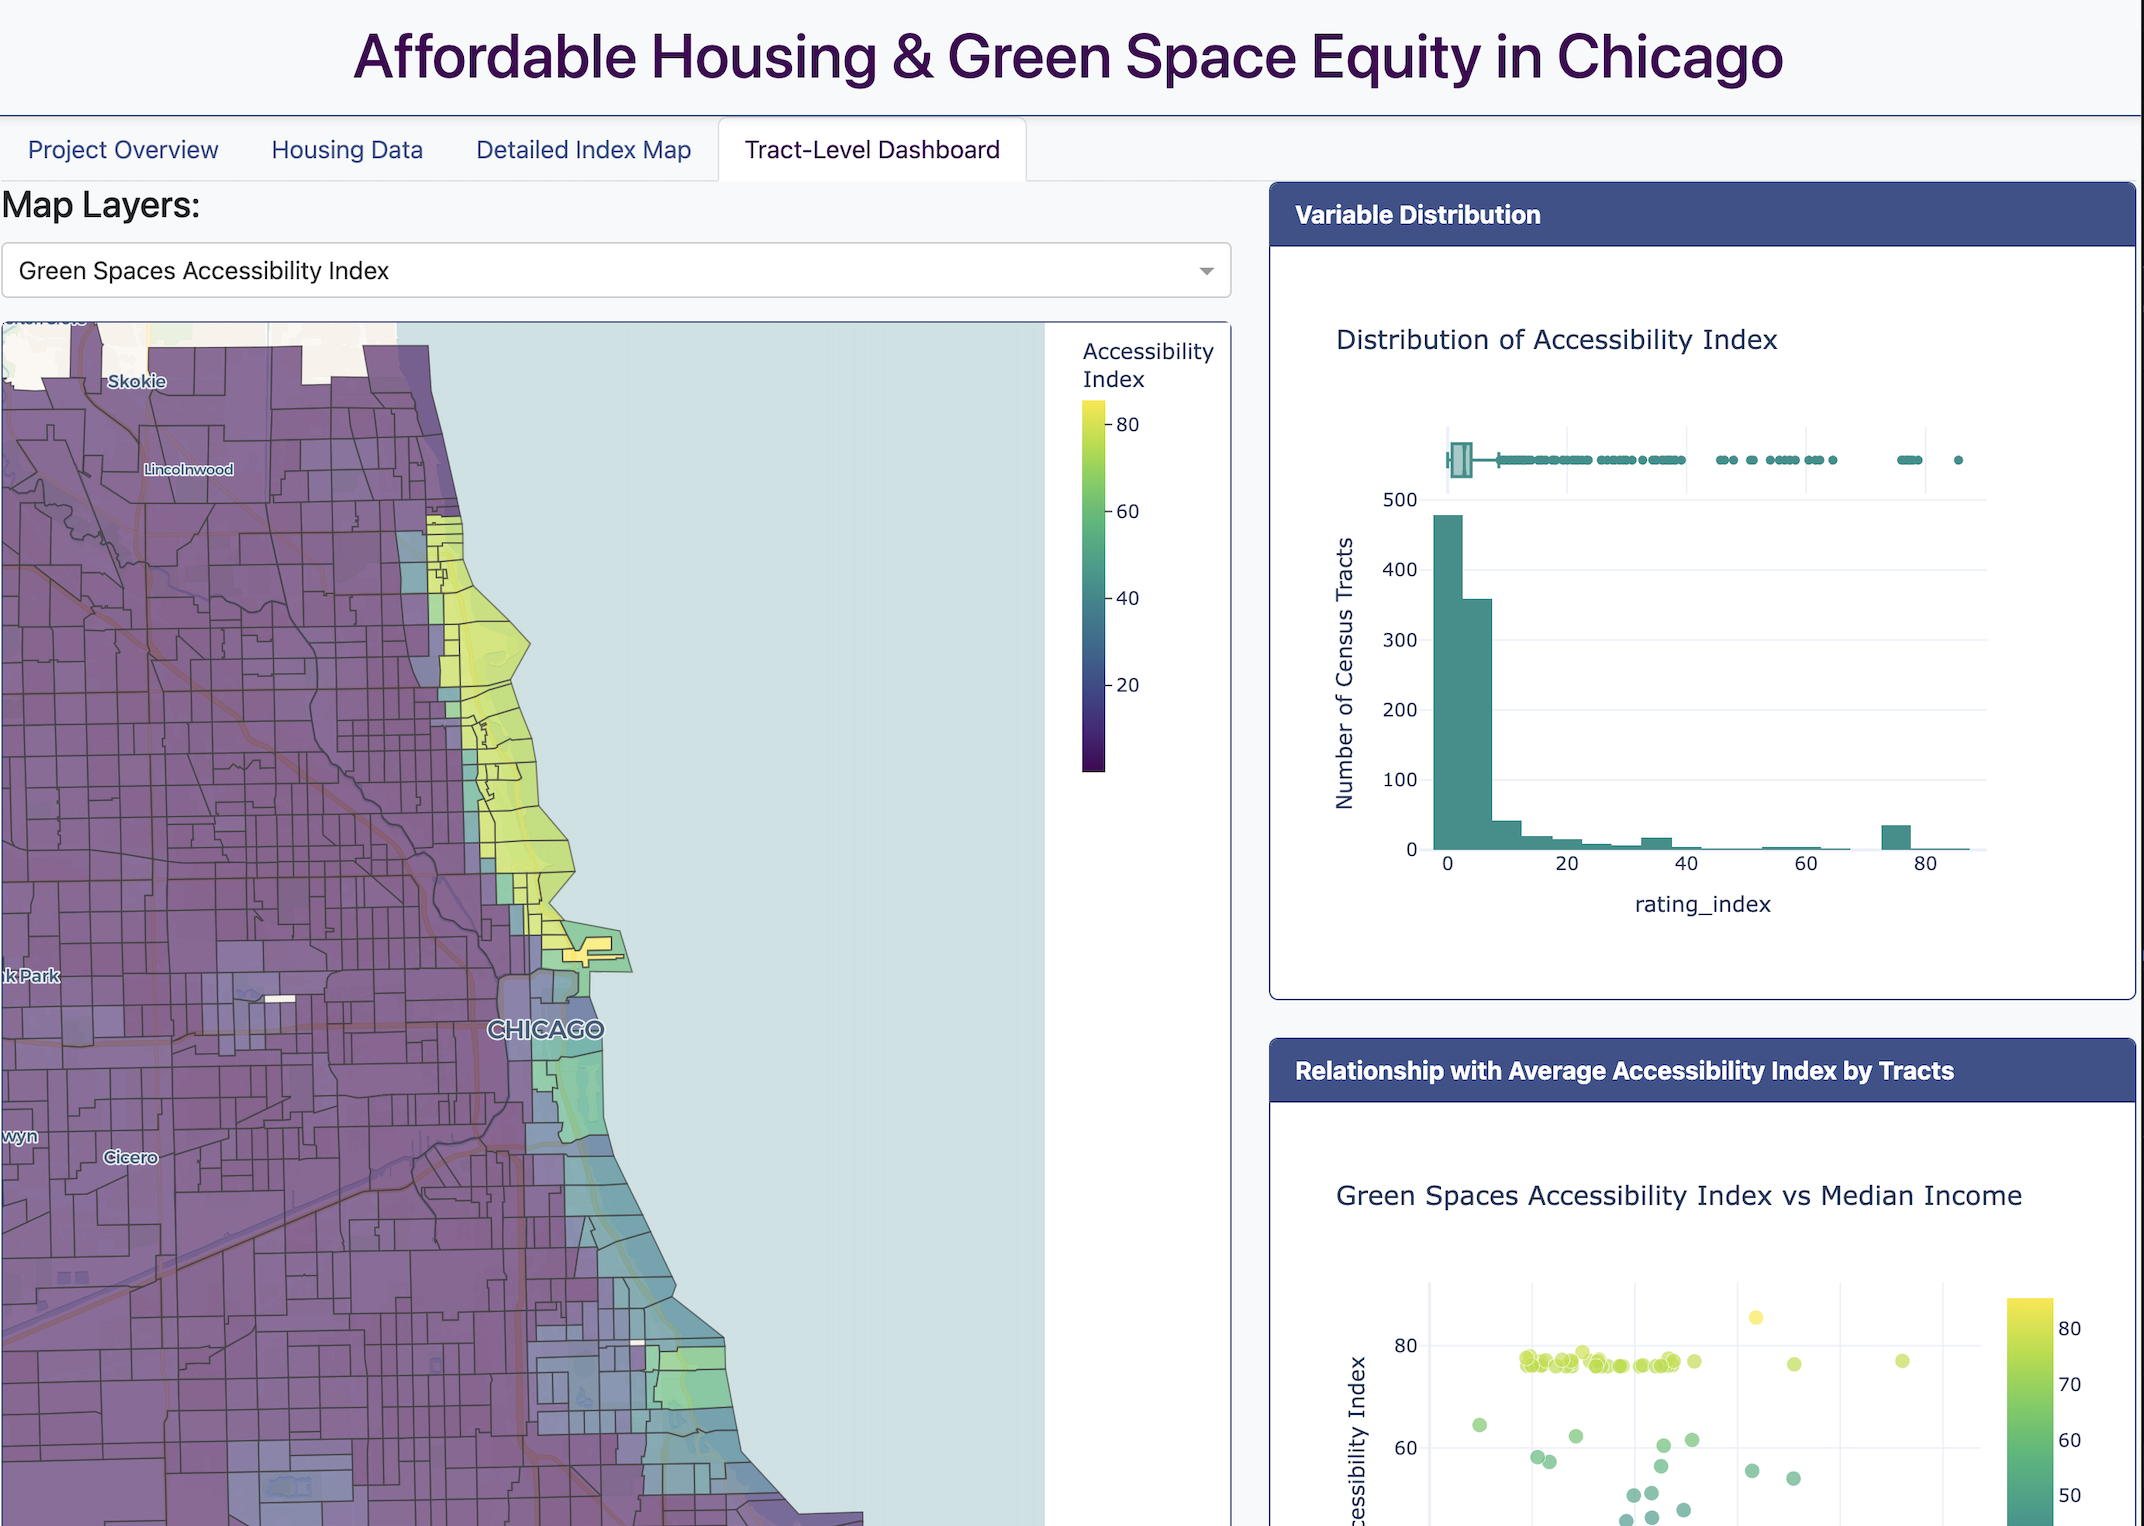
Green Space Accessibility in Chicago
- This project analyzes disparities in access to high-quality public parks near affordable housing buildings in Chicago.
- As part of this group project, my main role was synthesizing the different data sources and building our accessibility index.
Python · GeoPandas
Dashboard
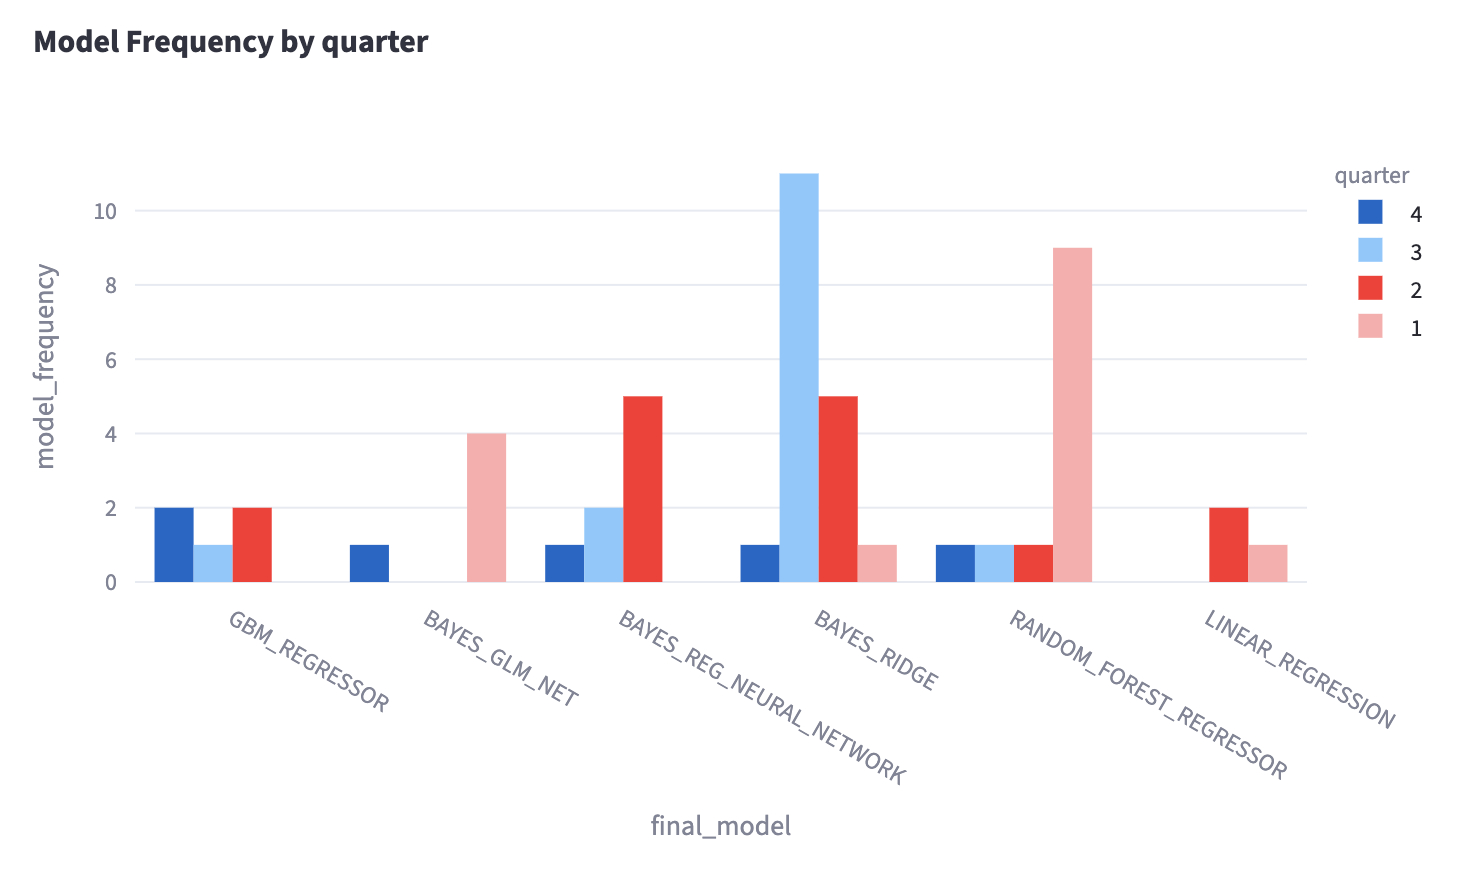
Fraym's Model Performance
- This dashboard provides high-level analytics on Fraym model performance, including model/feature frequency and comparisons of RMSE and training time across jobs and models. It runs on a customizable sample of Fraym-produced layers.
- The dashboard was built as a first step toward broader transparency into model performance.
Python · Streamlit · AWS S3 · DBeaver

Interactive Visualization
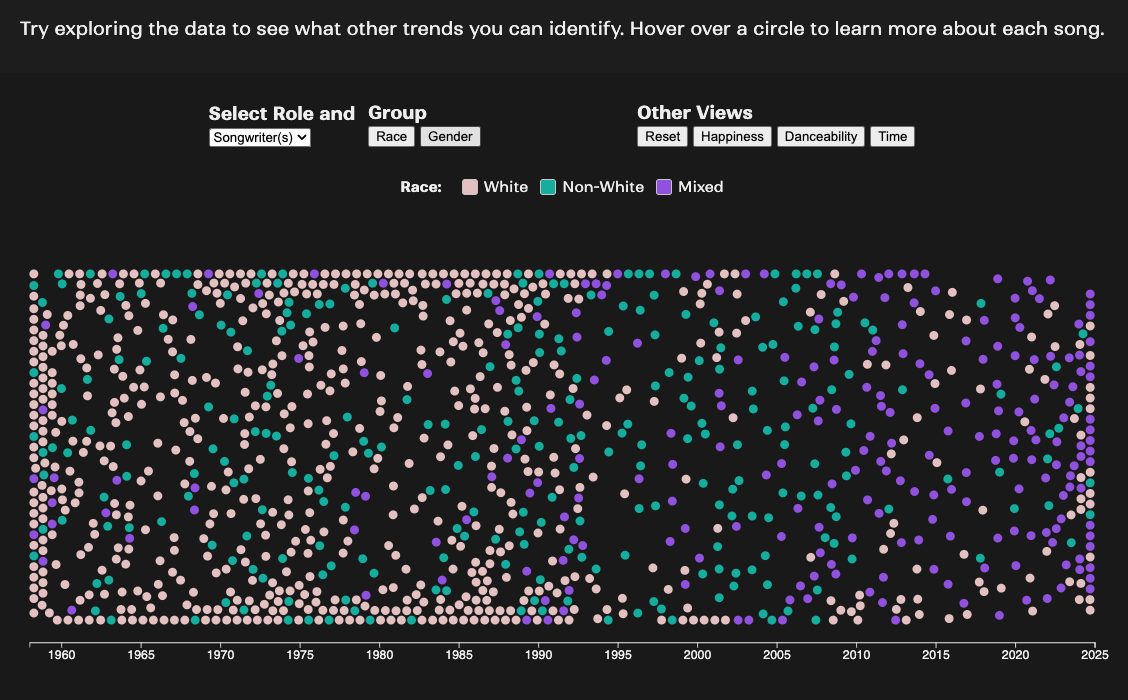
Hottest U.S. Songs
- Visualizes trends for songs that hit #1 on the Billboard chart since 1958.
- The visualization reveals some disparities in the music industry. For example, women are much more often singers but less often songwriters.
Python · D3 · JS · HTML/CSS · Cloudflare
Web Application
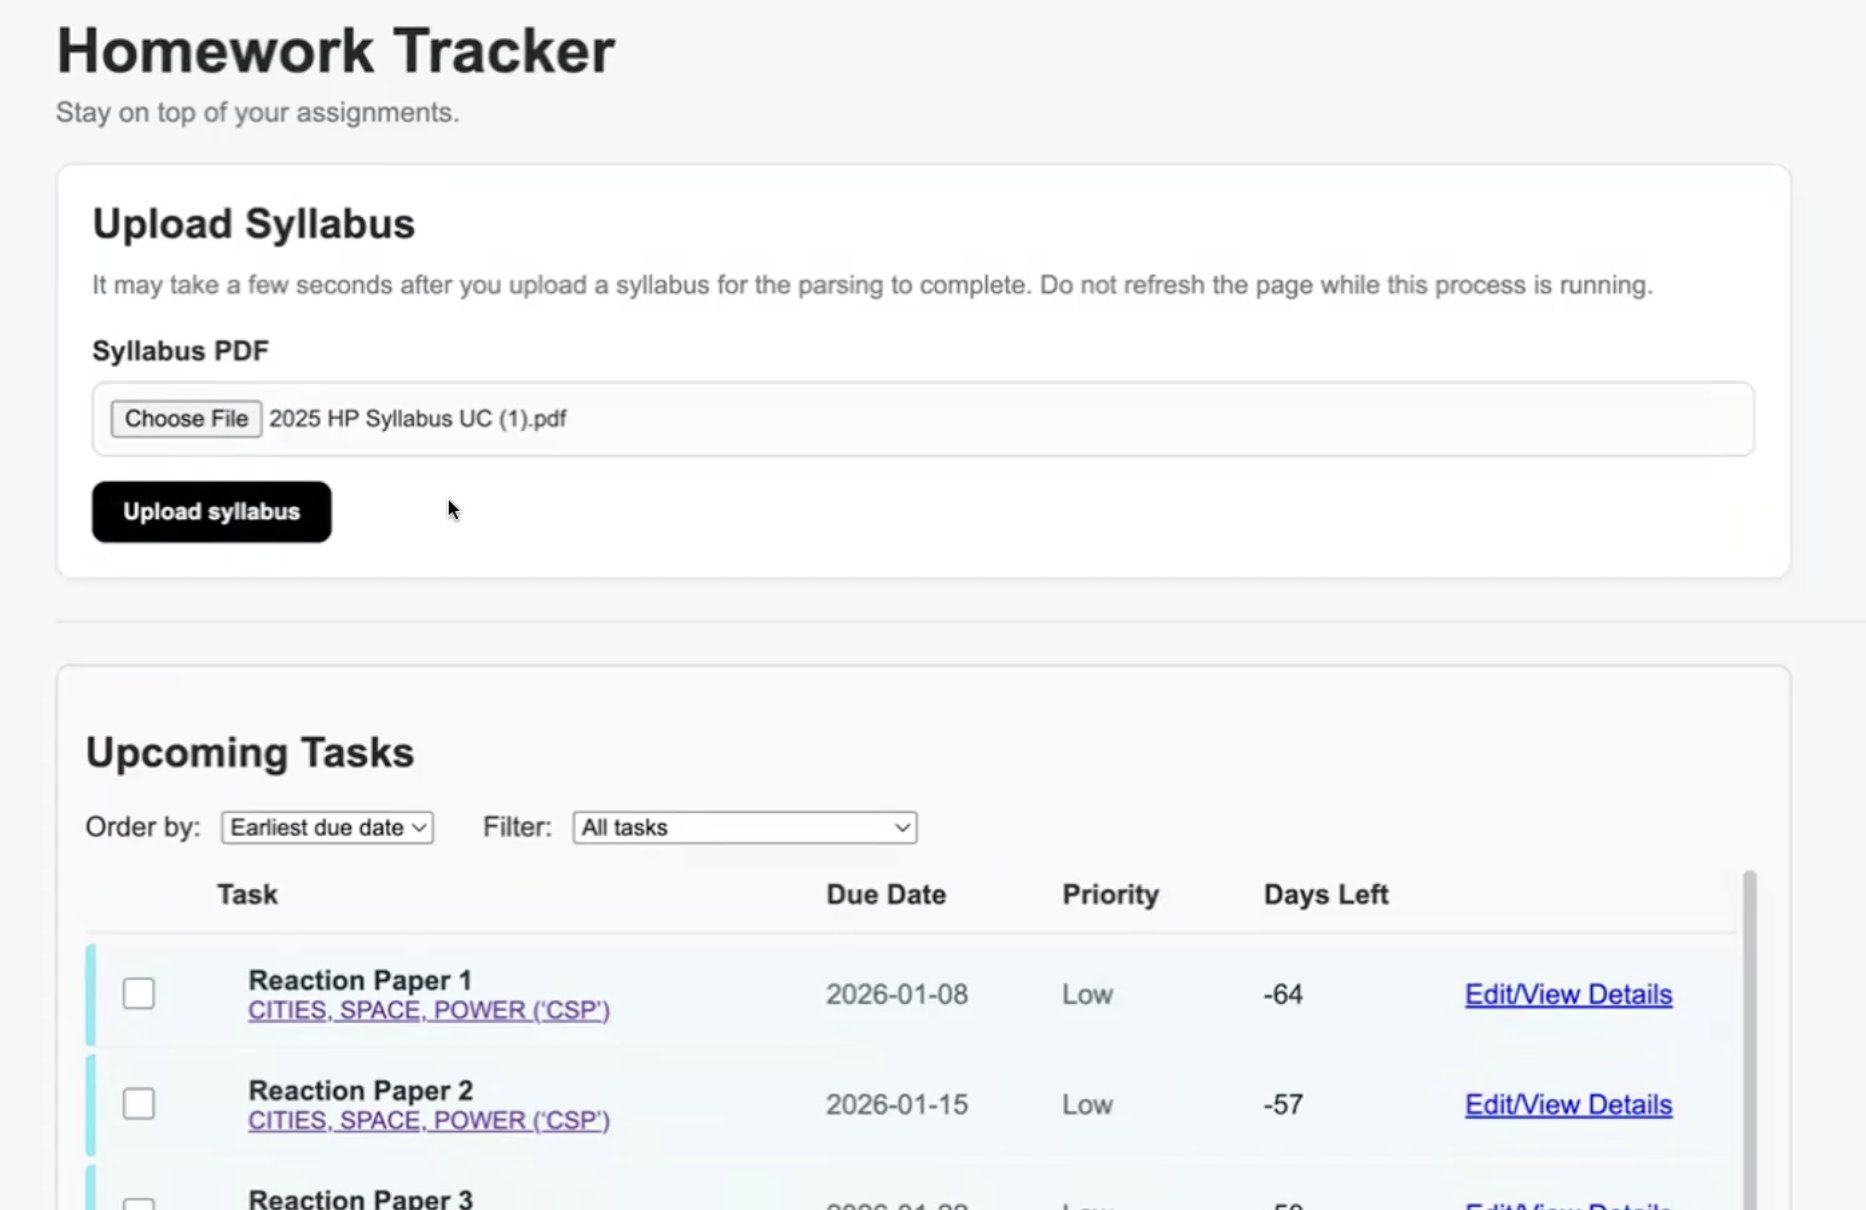
Homework Tracker App
- Ingests PDF syllabi and extracts structured assignment data such as due dates, priority, and exam flags into a sortable task dashboard.
- Built to eliminate the overhead of manually inputting and tracking assignments across multiple courses.
Ruby on Rails · HTML/CSS · PostgreSQL
My current tech stack
Python
MySQL
JavaScript
D3
Svelte
Django
HTML
CSS
R
Git
AWS
Ruby on Rails